9 easy ways to improve student engagement


9 easy ways to improve student engagement

Student motivation is one of the most vexing challenges that instructors face. Students can’t learn if they aren’t engaged, and serious classroom material often fails to pique the interest of a generation that has grown up with the constant stimulation of smartphones, social media and video on demand.

Some instructors argue that motivation should be up to students, who are paying to come to college, after all. Most certainly, instructors can’t make students learn. Students have to cultivate that desire on their own. Instructors can take many steps to stoke that desire to learn, though, by drawing students into subject matter and into learning in general.

In a pedagogy class I’m teaching this semester, students and I worked through some of the steps we can take to motivate students. This is hardly a comprehensive list, but it touches on concrete steps that any instructor can take to draw students into class material and into learning.

Find links. Helping students make connections among seemingly unrelated topics deepens their thinking and expands their ability to learn. By tying their interests (say, music) to more challenging subject matter (the workings of the brain, for instance, or American history), we can motivate students to further their exploration and broaden their learning. As John Bransford, Ann Brown and Rodney Cocking write in How People Learn, helping students understand the usefulness of a subject can improve learning, as can making sure material is neither too difficult nor too easy and providing opportunities to share with others.

Vary class time. Approaching class in the same way every time lulls students into a routine that can lead to their tuning out or shutting down. Put yourself in students’ shoes: They may have three or four classes in a single day. That alone makes concentration a challenge. Things like breaking a 75-minute class into three or four small topics, playing a short video or audio clip at some point, or even having students stand up for a minute or two can break a routine and refocus attention.

Give students choices. We all need some sense of control over what we do and how we do something. Giving students choices on project topics, readings or quiz questions gives them at least some sense of control and ownership.

Use hands-on activities. Evidence is clear that active learning, in which students engage in discussions, work on problems, or take on questions in groups, is a far better means of instruction than lecture. All instructors need time to explain things to students, but the real learning begins when students engage with material in authentic ways.

Move around the room. Moving about the classroom or encouraging students to move about and talk with classmates can help maintain students’ attention. This also helps instructors get to know students better.

Encourage students. A few words of encouragement can go a long way in keeping students engaged. Remind students that learning takes time and that their peers struggle, as well. Don’t resort to false praise, but point out good elements in students’ work and help them build on those elements.

Make individual connections. Show your humanity and help students understand who you are as a person. That doesn’t mean befriending students, but learning their names, remembering faces, and talking to students about their interests and aspirations helps personalize the learning process and helps draw students into that process.

Use humor. Instructors don’t have to be stand-up comedians, but displaying a sense of humor makes them more relatable, diminishes anxiety and sends a message that learning can be fun.

Use games. The gamification of learning has grown considerably since the turn of the century, but games that help students learn have been part of learning for as long as there have been games. So using a game strategy in a class doesn’t require great technical know-how. For instance, I have created “Jeopardy” games in PowerPoint to help students learn grammar, and crossword puzzles to help them practice research skills. Those strategies require preparation, but I’ve found them very effective.

There are many other approaches to engaging students. Some require prep time and trial and error from instructors, but many others require little more than an open mind. We’d love to hear the strategies that work best for you.

It’s time to move beyond a bogeyman view of assessment


It’s time to move beyond a bogeyman view of assessment

Two vastly different views of assessment whipsawed many of us over the past few days.

The first, a positive and hopeful view, pulsed through a half-day of sessions at KU’s annual Student Learning Symposium on Friday. The message there was that assessment provides an opportunity to understand student learning. Through curiosity and discovery, it yields valuable information and helps improve classes and curricula.

The second view came in the form of what a colleague accurately described as a “screed” in The New York Times. It argued that assessment turns hapless faculty members into tools of administrators and accreditors who seek vapid data on meaningless “learning outcomes” to justify an educational business model.

As I said, it was hard not to feel whipsawed. So let’s look a bit deeper into those two views and try to figure out what’s going on.

Clearly, the term “assessment” has taken on a lot of baggage over the last two decades. Molly Worthen, the North Carolina professor who wrote the Times op-ed article, highlights nearly every piece of that baggage: It is little more than a blunt bureaucratic instrument imposed from outside and upon high. It creates phony data. It lacks nuance. It fails to capture the important aspects of education. It is too expensive. It burdens overtaxed instructors. It generates little useful information. It blames instructors for things they have no control over. It is a political, not an educational, tool. It glosses over institutional problems.

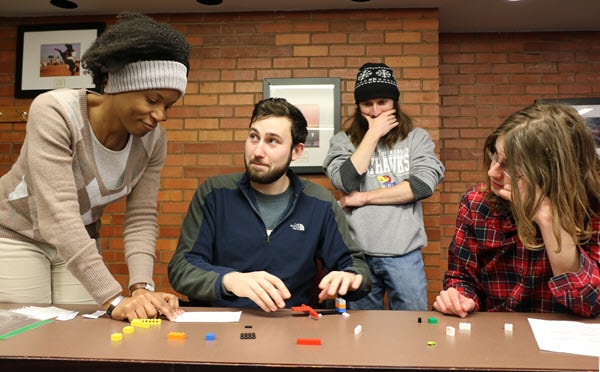
Dawn Shew works on a poster during a session at the Student Learning Symposium. With her are, from left, Ben Wolfe, Steve Werninger and Kim Glover.

“Without thoughtful reconsideration, learning assessment will continue to devour a lot of money for meager results,” Worthen writes. “The movement’s focus on quantifying classroom experience makes it easy to shift blame for student failure wholly onto universities, ignoring deeper socio-economic reasons that cause many students to struggle with college-level work. Worse, when the effort to reduce learning to a list of job-ready skills goes too far, it misses the point of a university education.”

So if assessment is such a burden, why bother? Yes, there are political reasons, but assessment seems a reasonable request. If we profess to educate students, shouldn’t we be able to provide evidence of that? After all, we demand that our students provide evidence to back up arguments. We demand that our colleagues provide evidence in their research. So why should teaching and learning be any different?

I’m not saying that the assessment process is perfect. It certainly takes time and money to gather, analyze and present meaningful evidence, especially at the department, school or university level. At the learning symposium, an instructor pointed out that department-level assessment had essentially become an unfunded mandate, and indeed, if imposed from outside, assessment can seem like an albatross. And yet, it is hardly the evil beast that Worthen imagines.

Yes, in some cases assessment is required, and requirements make academics, who are used to considerable autonomy, chafe. But assessment is something we should do for ourselves, as I’ve written before. Think of it as a compass. Through constant monitoring, it provides valuable information about the direction and effectiveness of our classes and curricula. It allows us to make adjustments large and small that lead to better assignments and better learning for our students. It allows us to create a map of our curricula so that we know where individual classes move students on a journey toward a degree. In short, it helps us keep education relevant and ensures that our degrees mean something.

New data about assessment

That view lacks universal acceptance, but it is gaining ground. Figures released at the learning symposium by Josh Potter, the university’s documenting learning specialist, show that 73 percent of degree programs now report assessment data to the university, up from 59 percent in 2014. More importantly, more than half of those programs have discussed curriculum changes based on the assessment data they have gathered. In other words, those programs learned something important from assessment that encouraged them to take action.

That’s one of the most important aspects of assessment. It’s not just data we send into the ether. It’s data that can lead to valuable discussion and valuable understanding. It’s data that helps us make meaningful revisions.

The data that Potter released pointed to challenges, as well. Less than a third of those involved in program assessment say that their colleagues understand the purpose of assessment, that their department recognizes their work in assessment, or that they see a clear connection between assessment and student learning. Part of the problem, I think, is that many instructors want an easy-to-apply, one-size-fits-all approach. There simply is no single perfect method of assessment, as Potter makes clear in the many conversations he has with faculty members and departments. Another problem is that many people see it as a high-stakes game of gotcha, which it isn’t, or shouldn’t be.

“Assessment isn’t a treasure hunt for deficiencies in your department,” Potter said Friday.

Rather, assessment should start with questions from instructors and should include data that helps instructors see their courses in a broader way. Grades often obscure the nuances of learning and understanding. Assessment can make those nuances clearer. For instance, categories in a rubric add up to a grade for an individual student, but aggregate scores for each of those categories allow us to see where a broad swath of students need work or where we need to improve our instruction, structure assignments better, or revisit topics in a class.

Assessment as a constant process

That’s just one example. Individually, we subconsciously assess our classes day by day and week by week. We look at students’ faces for signs of comprehension. We judge the content of their questions and the sophistication of their arguments. We ask ourselves whether an especially quiet day in class means that students understand course material well or don’t understand at all.

The goal then should be to take the many meaningful observations we make and evidence we gather in our classes and connect them with similar work by our colleagues. By doing that on a department level, we gain a better understanding of curricula. By doing it on a university level, we gain a better understanding of degrees.

I’m not saying that any of this is easy. Someone has to aggregate data from the courses in a curriculum, and someone – actually, many someones – has to analyze that data and share results with colleagues. Universities need to provide the time and resources to make that happen, and they need to reward those who take it on. Assessment can’t live forever as an unfunded mandate. Despite the challenges that assessment brings, though, it needs to be an important part of what we do in higher education. Let me go back to Werther’s op-ed piece, which despite its screed-like tone contained nuggets of sanity. For instance:

“Producing thoughtful, talented graduates is not a matter of focusing on market-ready skills. It’s about giving students an opportunity that most of them will never have again in their lives: the chance for serious exploration of complicated intellectual problems, the gift of time in an institution where curiosity and discovery are the source of meaning.”

I agree wholeheartedly, and I think most of my colleagues would, too. A college education doesn’t happen magically, though. It requires courses to give it shape and curricula to give it meaning. And just as we want our students to embrace curiosity and discovery to guide their journey of intellectual exploration, so must we, their instructors, use curiosity and discovery to guide the constant development and redevelopment of our courses. That isn’t about “quantifying classroom experience,” as Werther argues. It’s about better understanding who we are and where we’re going.

Making peer review of teaching more meaningful


Making peer review of teaching more meaningful

By Doug Ward

A peer review of teaching generally goes something like this:

An instructor nears third-year review or promotion. At the request of the promotion and tenure committee, colleagues who have never visited the instructor’s class hurriedly sign up for a single visit. Sometimes individually, sometimes en masse, they sit uncomfortably among wary students for 50 or 75 minutes. Some take notes. Others don’t. Soon after, they submit laudatory remarks about the instructor’s teaching, relieved that they won’t have to visit again for a few years.

ChangHwan Kim (left), Tracey LaPierre and Paul Stock discuss their plans for evaluating teaching in the sociology department. They gathered with faculty members from four other units at the inaugural meeting of the Benchmarks for Teaching Effectiveness Project.

If your department or school has a better system, consider yourself lucky. Most peer evaluations lack guidelines that might offer meaningful feedback for a candidate and a P&T committee, and they focus almost exclusively on classroom performance. They provide a snapshot at best, lacking context about the class, the students or the work that has gone into creating engagement, assignments, evaluations and, above all, learning. Academics often refer to that approach as a “drive-by evaluation,” as reviewers do little but breeze past a class and give a thumbs-up out the window.

Those peer evaluations don’t have to be a clumsy, awkward and vapid free-for-all, though. Through the Benchmarks for Teaching Effectiveness Project, we have begun a process intended to make the evaluation of teaching much richer and more meaningful. The project is financed through a five-year, $612,000 National Science Foundation grant and is part of a larger NSF project that includes the University of Colorado, Michigan State, and the University of Massachusetts, Amherst.

We have used the NSF grant to distribute mini-grants to four departments and one school that will pilot the use of a rubric intended to add dimension and guidance to the evaluation of teaching. Faculty members in those units will work with colleagues to define and identify the elements of good teaching in their discipline, decide on appropriate evidence, adapt the rubric, apply it in some way, and share experiences with colleagues inside and outside the department and the university. Evidence will come from three sources: the instructor, students and peers, with departments deciding how to weight the evidence and to weight the categories in the rubric.

Not surprisingly, the instructors involved in the project had many questions about how the process might play out as they gathered for the first time in February: What types of evidence are most reliable? How do we reduce conscious or unconscious bias in the evaluation process? How do we gain consensus among colleagues for an expanded evaluation process and for application of a new system of evaluation? How can we create a more meaningful process that doesn’t eat up lots of time?

Those are important questions without simple answers, but the departments that have signed on in this initial stage of the project have already identified many worthy goals. For instance, Sociology, Philosophy and Biology hope to reduce bias and improve consistency in the evaluation process. Chemical and Petroleum Engineering plans to create triads of faculty members who will provide feedback to one another. Public Affairs and Administration sees opportunities for enriching the enjoyment of teaching and for inspiring instructors to take risks to innovate teaching.

All the units will use the rubric to foster discussion among their colleagues, to identify trustworthy standards of evidence, and, ultimately, to evaluate peers. Philosophy and sociology see opportunities for better evaluating graduate teaching assistants, as well. Chemical and Petroleum Engineering hopes to use the rubric to guide and evaluate 10 faculty members on tenure track. Sociology plans to use it to guide peer evaluation of teaching. Public Affairs and Administration plans to have a group of faculty alternate between evaluator and evaluee as they hone aspects of the rubric. Biology plans to explore the best ways to interpret the results.

That range of activities is important. By using the rubric to foster discussion about the central elements of teaching – and its evaluation – and then testing it in a variety of circumstances, instructors will learn valuable information about the teaching process. That feedback will allow us to revise the rubric, create better guidelines for its use, and ultimately help as many departments as possible adopt it for the promotion and tenure process.

All of the faculty members working in the initial phase of the Benchmarks project recognize the complexity and challenge of high-quality teaching. They also recognize the challenges in creating a better system of evaluation. Ultimately, though, their work has the potential to make good teaching more transparent, to make the evaluation of teaching more nuanced, and to make teaching itself a more important part of the faculty evaluation process.

Work your way through college? Not anymore

Kansas students would need to work nearly 30 hours a week at minimum wage to pay for college, even if they received grants and scholarships, according to an analysis by the public policy organization Demos.

In only eight other states would students need to work more hours to pay for college. New Hampshire, which would require more than 41 hours of work a week, was No. 1, followed by Pennsylvania (39.8 hours) and Alabama (36 hours).

Students attending college in Washington State would need to work the fewest hours (11.6), followed by California (12.6) and New York (15).

“In the vast majority of states, the idea of working your way through college is no more than an antiquated myth,” Demos writes. “A combination of low minimum wages and high college prices make borrowing an inevitability for students.”

The average yearly cost of attending Kansas universities is $16,783, Demos says. That’s 86 percent higher than it was in 2001, putting Kansas at No. 32 in average cost of attendance for public universities. New Hampshire had the highest average cost ($26,008), followed by Vermont ($25,910) and New Jersey ($25,544). Utah ($13,344) had the lowest average cost, followed by Wyoming ($13,942) and Idaho ($14,211).

Demos, which tilts liberal in its ideology, calculated the rankings using data from the federal government’s Integrated Postsecondary Education Data System and the Department of Labor. It created a “net price” for each state by subtracting average scholarship and grant aid from the average tuition and fees for four-year colleges in each state.

That approach has many flaws. In Kansas, for instance, tuition and fees vary widely among four-year universities and even within schools at those universities. Averaging also masks a wide variance in the amount of financial aid students receive. Looking only at cost of attendance skews the picture even further, as housing, food and other expenses generally exceed the cost of tuition and fees, especially in the Northeast and West Coast.

Even so, the study offers a reality check about college costs. State investment in higher education has declined even as the number of students attending college, and the diversity among those students, has grown. In Kansas, tuition now covers an average of 53 percent of a university’s costs, compared with 28 percent in 2001. Even that looks good compared with states like New Hampshire, where tuition accounts for 79 percent of university revenue, Delaware (75 percent) and Pennsylvania (73 percent).

Then again, in Wyoming, tuition dollars account for only 13 percent of college budgets. That is considerable lower than the states that follow: California (21 percent) and Alaska (30 percent) . In all states but Wyoming, tuition dollars now account for a greater share of university budgets that they did in 2001.

As Demos writes, “our state and federal policymakers have been vacating the compact with students that previous generations enjoyed.” It’s no wonder students have sought to put political pressure on schools and legislators.

The disinvestment in higher education began in the 1970s as a political message of lower taxes and smaller government started gaining ground. It accelerated during economic downturns and has only recently begun to ease. To compensate, colleges and universities have cut staff, hired fewer tenure-track professors, increased class size, and relied increasingly on low-paid adjunct instructors for teaching. Students and their families have taken on larger amounts of debt to finance their education.

As Demos writes: “When states do not prioritize higher education as a public good, students and families generally bear the burden.”


Doug Ward is the associate director of the Center for Teaching Excellence and an associate professor of journalism. You can follow him on Twitter @kuediting.

Using data to illuminate teaching and learning


Using data to illuminate teaching and learning

By Doug Ward

BLOOMINGTON, Indiana – We have largely been teaching in the dark.

By that, I mean that we know little about our students. Not really. Yes, we observe things about them and use class surveys to gather details about where they come from and why they take our classes. We get a sense of personality and interests. We may even glean a bit about their backgrounds.

That information, while helpful, lacks many crucial details that could help us shape our teaching and alert us to potential challenges as we move through the semester. It’s a clear case of not knowing what we don’t know.

Participants at a Learning Analytics Summit workshop grapple with definitions of student success and with how they might use data to better understand teaching and learning.

That became clear to me last week at the first Learning Analytics Summit at Indiana University. The summit drew more than 60 people from universities around the country to talk about how to make more effective use of academic data. I led workshops on getting started with data projects for analyzing courses, curricula, student learning and student success. As I listened and spoke with colleagues, though, I was struck by how little we know about our courses, curricula and students, and how much we stand to gain as we learn more.

Let me provide examples from the University of California-Davis and the University of New Mexico, two schools that have been piloting electronic systems that give instructors vast amounts of information about students before classes start.

Marco Molinaro, assistant vice provost for educational effectiveness at UC-Davis, showed examples of a new system that provides instructors with graphics-rich digital pages with such details as the male-female balance of a class, the number of first-generation students, the number of low-income students, the number of underrepresented minorities, the number of students for whom English is a second language, the number of students who are repeating a class, the most prevalent majors among students in a class, previous classes students have taken, other courses they are taking in the current semester, how many are using tutoring services, comparisons to previous classes the instructor has taught, and comparisons to other sections of the same class.

For privacy reasons, none of that data has names associated with it. It doesn’t need to. The goal isn’t to single out students; it’s to put information into the hands of faculty members so they can shape their classes and assignments to the needs of students.

That data can provide many insights, but Molinaro and his staff have gone further. In addition to tables and charts, they add links to materials about how to help different types of students succeed. An instructor who has a large number of first-generation students, for instance, receives links to summaries of research about first-generation students, advice on teaching strategies that help those students learn, and an annotated bibliography that allows the instructor to go deeper into the literature.

Additionally, Molinaro and his colleagues have begun creating communities of instructors with expertise in such areas as working with first-generation students, international students, and low-income students. They have also raised awareness about tutoring centers and similar resources that students might be using or might benefit from.

Molinaro’s project is funded by a $1 million grant from the Howard Hughes Medical Institute. It began last fall with about 20 faculty members piloting the system. By the coming fall, Molinaro hopes to open the system to 200 to 300 more instructors. Eventually, it will be made available to the entire faculty.

Embracing a ‘cycle of progress’

Providing the data is just the first step in a process that Molinaro calls a “cycle of progress.” It starts with awareness, which provides the raw material for better understanding. After instructors and administrators gain that understanding, they can take action. The final step is reflection, which allows all those involved an opportunity to evaluate how things work – or don’t work – and make necessary changes. Then the cycle starts over.

“This has to go on continuously at our campuses,” Molinaro said.

As Molinaro and other speakers said, though, the process has to proceed thoughtfully.

For instance, Greg Heileman, associate provost for student and academic life at the University of Kentucky, warned attendees about the tendency to chase after every new analytics tool, especially as vendors make exaggerated claims about what their tools can do. Heileman offered this satiric example:

First, a story appears in The Chronicle of Higher Education.

“Big State University Improves Graduation Rates by Training Advisors as Mimes!”

The next day, Heileman receives email from an administrator. The mime article is attached and the administrator asks what Heileman’s office is doing about training advisors to be mimes. The next day, he receives more email from other administrators asking why no one at their university had thought of this and how soon he can get a similar program up and running.

The example demonstrates the pressure that universities feel to replicate the success of peer institutions, Heileman said, especially as they are being asked to increase access and equity, improve graduation rates, and reduce costs. On top of that, most university presidents, chancellors and provosts have relatively short tenures, so they pressure their colleagues to show quick results. Vendors have latched onto that, creating what Heileman called an “analytics stampede.”


Chris Fischer, associate professor of physics and astronomy at KU, speaks during a poster session at the analytics conference in Bloomington, Indiana.

The biggest problem with that approach, Heileman said, is that local conditions shape student success. What works well at one university may not work well at another.

That’s where analytics can play an important role. As the vice provost for teaching and learning at the University of New Mexico until last fall, Heileman oversaw several projects that relied on university analytics. One, in which the university looked at curricula as data for analysis, led to development of an app that allows students to explore majors and to see the types of subjects they would study and classes they would take en route to a degree. That project also led to development of a website for analysis and mapping of department curricula.

One metric that emerged from that project is a “blocking factor,” which Heileman described as a ranking system that shows the likelihood that a course will block students’ progression to graduation. For instance, a course like calculus has a high blocking factor because students must pass it before they can proceed to engineering, physics and other majors.

Better understanding what classes slow students’ movement through a curriculum allows faculty and administrators to look more closely at individual courses and find ways of reducing barriers. At New Mexico, he said, troubles in calculus were keeping engineering students from enrolling in several other classes. The order of classes also created complexity that made graduation more difficult. By shifting some courses, students began taking calculus later in the curriculum. That made it more relevant – and thus more likely that students would pass – and helped clear a bottleneck in the curriculum.

Used thoughtfully, Heileman said, data tells a story and allows us to formulate effective strategies.

Focusing on retention and graduation

Dennis Groth, vice provost for undergraduate education at Indiana, emphasized the importance of university analytics in improving retention and graduation rates.

Data, he said, can point to “signs of worry” about students and prompt instructors, staff members and administrators to take action. For instance, Indiana has learned that failure to register for spring classes by Thanksgiving often means that students won’t be returning to the university. Knowing that allows staff members to reach out to students sooner and eliminate barriers that might keep them from graduating.

Data can also help administrators better understand student behavior and student pathways to degrees. Many students come to the university with a major in mind, Groth said, but after taking their first class in that major, they “scatter to the wind.” Many find they simply don’t like the subject matter and can’t see themselves sticking with it for life. Many others, though, find that introductory classes are poorly taught. As a result, they search elsewhere for a major.

“If departments handled their pre-majors like majors,” Groth said, “they’d have a lot more majors.”

Once students give up on what Groth called “aspirational majors,” they move on to “discovery majors,” or areas they learn about through word of mouth, through advisors, or through taking a class they like. At Indiana, the top discovery majors are public management, informatics and psychology.

“Any student could be your major,” Groth said. That doesn’t mean departments should be totally customer-oriented, he said, “but students are carried along by excitement.”

“If your first class is a weed-out class, that chases people away,” Groth said.

Indiana has also made a considerable amount of data available to students. Course evaluations are all easily accessible to students. So are grade distributions for individual classes and instructors. That data empowers students to make better decisions about the majors they choose and the courses they take, he said. Contrary to widespread belief, he said, a majority of students recommend nearly every class. Students are more enthusiastic about some courses, he said, but they generally provide responsible evaluations.

In terms of curriculum, Groth said universities needed to take a close look at whether some high-impact practices were really having a substantial impact. At Indiana, he said, the data are showing that learning communities haven’t led to substantial improvements in retention or in student learning. They aren’t having any negative effects, he said, but they aren’t showing the types of results that deserve major financial support from the university.

As more people delve into university data, even the terms used are being re-evaluated.

George Rehrey, director of Indiana’s recently created Center for Learning Analytics and Student Success, urged participants to rethink the use of the buzzword “data-driven.” That term suggests that we follow data blindly, he said. We don’t, or at least we shouldn’t. Instead, Rehrey suggested the term “data-informed,” which he said better reflected a goal of using data to solve problems and generate ideas, not send people off mindlessly.

Lauren Robel, the provost at Indiana, opened the conference with a bullish assessment of university analytics. Analytics, she said, has “changed the conversation about student learning and student success.”

“We can use this to change human lives,” Robel said. “We can literally change the world.”

I’m not ready to go that far. University analytics offer great potential. But for now, I’m simply looking for them to shed some light on teaching and learning.

Data efforts at KU

KU has several data-related projects in progress. STEM Analytics Teams, a CTE project backed by a grant from the Association of American Universities, have been drawing on university data to better understand students, programs and progression through curricula. The university’s Visual Analytics system makes a considerable amount of data available through a web portal. And the recently created Business Intelligence Center is working to develop a data warehouse, which will initially focus on financial information but will eventually expand to such areas as curriculum, student success and other aspects of academic life. In addition, Josh Potter, the documenting learning specialist at CTE, has been working with departments to analyze curricula and map student pathways to graduation.


Doug Ward is the associate director of the Center for Teaching Excellence and an associate professor of journalism. You can follow him on Twitter @kuediting.

How students have taken learning into the community


How students have taken learning into the community

Collin Bruey and Laura Phillips check out posters at the Service Showcase. Bruey and Phillips created their own poster about work at the Center for Community Outreach.

By Doug Ward

I’m frequently awed by the creative, even life-changing, work that students engage in.

The annual Service Showcase sponsored by the Center for Service Learning, provides an impressive display of that work. This year’s Showcase took place last week. As a judge for the Showcase over the past two years, I’ve learned how deeply some students have become involved in the community. Here’s a sample of their work:

  • Improving a sense of community among residents of a local senior center
  • Documenting the risk of poverty on individuals’ health
  • Building a more sustainable community through community gardens, litter pickups and presentations
  • Creating support networks and building leadership skills among underrepresented youths
  • Tutoring of juvenile offenders at the Kansas Juvenile Correctional Complex
  • Teaching U.S. citizenship to refugees
  • Promoting discussion about inequality in Kansas City, Kan.
  • Raising awareness about the lack of food that many KU students face
  • Increasing physical activity among guests at the Lawrence Community Shelter

John Augusto, who directed the Center for Service Learning until early this year, said in an earlier interview that the annual poster event provided recognition for both students and community partners.

“We want to make sure that students understand that it’s OK to feel good about the work, but that what’s as important is that the community organization is getting a direct benefit from that work,” Augusto said. “It’s not just that I go in and I feel good about what I do but then the community organization has to clean up after my work. There really has to be a mutually beneficial relationship.”

He added: “I think what it teaches the students is that when they leave KU and they are in an environment in their professional life that’s different from what they’re used to, they need to learn to listen. A lot of times students tell us that when they’re doing this service work, and reflecting on it, they learn how to listen.”

This year’s winners were:

  • Tina Lai, graduate student
  • Razan Mansour, undergraduate individual student award
  • Jasmine Brown and Cierra Smallwood, undergraduate student group award

Short tenures vs. long-term thinking

As KU begins a search for a new provost, here’s something to keep in mind: Most provosts don’t stay in their jobs long.

The College and University Professional Association for Human Resources says the median tenure for provosts across the country is only three years. That’s the lowest among all types of administrators the organization surveyed.

Presidents and chief executives of universities stay in their jobs at a median rate of five years, about the same as leaders of human resources and student affairs.

From the website of the College and University Professional Association for Human Resources3

Jackie Bichsel, director of research for the association, is quoted as saying: “It’s not surprising that administrators overall have a relatively short median tenure. Given that those with many years of tenure do not make considerably greater salaries, their best chance of a raise may be to find a new position.”

Unfortunately, that’s the case in most jobs, both inside and outside academia. Employees sometimes talk about the “loyalty penalty,” meaning that those of us who stay at an institution for many years never get the bump in pay and other benefits that those who jump from job to job get. That becomes especially frustrating when considering that faculty salaries at KU rank near the bottom of the university’s peers.

I don’t begrudge anyone opportunities for higher pay or greater challenges. Bringing in new leaders can infuse a university with new energy and new ideas. And top leaders also feel squeezed from many sides as they take on everything from shaky budgets, rising college costs and flagging trust in higher education to polarized students and faculty, concerns about campus safety, small incidents blowing up on social media and in some cases, the survival of a university. There’s no doubt that university leaders have difficult jobs.

When those leaders change so frequently, though, a campus can easily shift to a short-term mentality. Administrators know they probably won’t stay on the job long, so they push for quick results that don’t necessarily serve the institution in the long term. Universities need to change, as I’ve written about frequently, but real change takes time, and the pressure to produce quick results makes it difficult to focus on much-needed systemic change. Quick turnover also makes it difficult to know whether leaders’ initiatives are really in a university’s best interests or whether they are simply meant to pad resumes for the next job search.

Further clouding the picture, many administrators push small initiatives but take a “wait and see” approach on innovation, preferring to let others experiment with new ideas, approaches, and technology rather than budgeting for experimentation. (Experimentation takes time, after all.) That’s one place where KU shines, at least in terms of teaching. The provost’s office has provided thousands of dollars in course transformation grants over the past few years, putting the university on the cutting edge in classroom innovations that help improve student learning. (Many of those innovations will be on display on Friday at CTE’s annual Celebration of Teaching.)

Choosing new leaders is a difficult task, as anyone who has served on a search committee can attest to. One thing seems clear, though: A university can’t rely on a single leader, or even a few leaders, to chart a path into the future. It must build a strong cohort of leaders around the university to keep the institution moving forward even as top leaders rotate in and out quickly.

Reclassifying STEM

Here’s a silly question: What is STEM?

If you said science, technology, engineering, and math, you’d be right, of course. You’d then have to explain what you mean by science, technology, engineering, and math, though.

Need help? Let’s consult the federal government.

The Department of Homeland Security says that STEM includes math, engineering, the biological sciences, the physical sciences and “fields involving research, innovation, or development of new technologies using engineering, mathematics, computer science, or natural sciences (including physical, biological, and agricultural sciences).”

That’s such a broad definition that it could theoretically apply to about anything. And that’s exactly what some universities hope to capitalize on as they try to attract more international students to the United States.

The Chronicle of Higher Education reports that universities have put such programs as economics, information science, journalism, classical art, archaeology, and applied psychology under the STEM umbrella. (Whether that will pass muster with the government remains to be seen.)

Why? Because international students who graduate in STEM fields are allowed to remain in the United States longer than those who receive non-STEM degrees, The Chronicle says. STEM graduates can work for three years in the U.S. after graduation, compared with one year for non-STEM grads.

International students, who generally pay full out-of-state tuition, have drawn increasing interest from public universities, which have struggled to make up for declining state funding. The number of international students has declined over the past couple of years, though. Nationally, there were 7 percent fewer international students in 2017-18 than in 2016-17, Inside Higher Ed reports. The largest declines were at universities in the Plains states (down 16 percent) and a region that encompasses Texas, Arkansas, and Louisiana (down 20 percent). At KU, the number of international students has declined 5.5 percent since a peak in 2016, according to university data.

I’ve heard of no moves to expand the STEM classification at KU, but some other universities have given themselves wide license to reclassify programs. In other words, STEM isn’t just about science, technology, engineering, and math. It’s also about marketing.

Worth repeating

“Good teaching is emotional work, requiring reserves of patience and ingenuity that are all-too-often depleted in overworked faculty members.”

—David Gooblar of the University of Iowa, writing about faculty burnout for The Chronicle of Higher Education

CTE-associated work leads to national awards


CTE-associated work leads to national awards

By Doug Ward

Projects associated with programs at the Center for Teaching Excellence have led to national recognition for two KU professors.

Ward Lyles, assistant professor of urban planning, received one of three curriculum innovation awards from the Association of Collegiate Schools of Planning and the Lincoln Institute of Land Policy. Lyles developed a quantitative methods course that uses team-based learning and focuses on the type of work planners do in their communities.

Lyles’s class emphasizes the importance of equity and inclusion, and he said his work in CTE’s inaugural Diversity Scholars Program allowed him to think through ways to make the class more inclusive. That includes reflection sessions on how personal and group identity shape thinking.

“Personal and group reflection gets students thinking about their own identities and experiences and how their unique characteristics shape their interactions with other people,” Lyles told KU News Service. “Recognizing similarities and differences between our own identities and experiences and those of people we work with is essential for collaboration.”

Genelle Belmas, associate professor of journalism and mass communications, won top honors in a teaching competition sponsored by the Law and Policy Division of the Association for Education in Journalism and Mass Communication.

Belmas used a course transformation grant from CTE to develop an interactive digital game called Whack-A-Judge. Her interest in the project grew from a popular journalism class called Gamification she developed a couple of years ago. (I wrote last year about an exercise she did in helping students move into a flow state.)

Whack-A-Judge is intended to help students learn concepts for First Amendment and Society, a 600-level class that focuses on media law. The game, which is modeled on the arcade game whack-a-mole, flashes questions at the bottom of an on-screen game board. Players click (or whack) on judges who emerge from holes on the board holding signs with the names of court cases. The goal is to whack the judge with the right answer before that judge disappears back into a hole.

Preliminary results showed that the game improved students’ test scores, Belmas said.

Where state money that might have gone to higher ed now goes

Adjusted for inflation, states’ per-student spending on higher education has declined by 25 percent since 1997.

That’s no surprise. I’ve written before about a similar decline in spending in Kansas.

Nor is it a surprise that tuition has risen as states have reduced their support of higher education. (More about that shortly.) It is interesting, though, to see details of how state cuts lead to increases in tuition and how education spending ranks among states’ priorities. Douglas Webber, an associate professor of economics at Temple University, explores those in an article in EdNext. Here are a few things he found:

  • Net tuition at a public four-year university doubled between 1997-98 and 2017-18 as states reduced per-student funding by 25 percent. Net tuition is what a student pays after grants and scholarships are figured in.
  • For every $1,000 per student that states cut from college and university budgets, tuition rises by $300. That translates into thousands of dollars coming directly from students’ pockets, or more likely, dollars added to students’ debt.
  • In total dollars, state funding for public higher education increased 13.5 percent between 1987 and 2015. Yes, it increased. The bigger issue is that during that same time, enrollment grew more than 57 percent. It’s a classic example of being asked to do more with less.

That growth in students especially taxes large state universities, which, Webber says, have taken in the vast majority of new students but “have long since exhausted their economies of scale.” That is, it is extremely difficult to add more students without charging more or reducing the quality of education.

Webber says that much of the money that might have gone into higher education is now going to Medicaid. He calls that one of the “tradeoffs facing state and local governments.” Here’s where state spending increased the most between 1987 and 2015, according to Webber’s analysis:

  • Public welfare (including Medicaid): up 200 percent
  • Health and hospitals: up 67 percent
  • Corrections: up 66 percent
  • Police and fire protection: up 59 percent
  • K-12 education: up 41 percent

Most certainly, rising health care costs are eating up more and more of states’ budgets. As Webber cautions, though, it’s impossible to say that an increase in one budget item “causes” a decrease in another. Nor must increases in one area lead to cuts in another. That’s a political decision. And Webber emphasizes that the figures are averages for all states. For instance, Vermont’s spending on public welfare increased three times more than Utah’s. Similarly, six states actually increased their per-student spending on higher education (Connecticut, Mississippi, Nebraska, New Mexico, Oklahoma, and Wyoming) while Pennsylvania cut its contributions by 56 percent.

As Webber says, there isn’t just one story about how states spend their money. There are 50 stories. The statistics, though, reflect the challenges that state lawmakers confront each time they create budgets. It has become clear over the past two decades, though, that higher education isn’t high on that list of budget priorities.

Briefly …

The University of Missouri system will eliminate or merge 12 graduate programs and eliminate 474 jobs as part of a $100 million budget cut, The St. Louis Post-Dispatch reports. You can see a list of the affected programs here. … The Department of Education expects to open bids this summer on development of $5 million in open educational resources, The Washington Post reports. Congress included that money in the 2018 federal budget. … Google has made Google Scholar easier to use on a smartphone. New mobile-friendly functions provide article previews and the ability to swipe through articles for reading. Google Scholar on mobile also allows you to save articles to a “My library” folder for later reading on a computer.

As campus bookstores disappear, universities lose an intellectual touchstone


As campus bookstores disappear, universities lose an intellectual touchstone

By Doug Ward

On a recent trip to Amherst, Mass., I strolled through the University of Massachusetts campus looking for a bookstore.

There was not a book to be found, at least outside the 30-story library. A technology shop, yes. A natural foods store, yes. A pastry counter, yes. A university apparel store, of course. But a bookstore? For that, you have to travel a mile or so to the Amherst town center.

UMass got rid of its physical campus bookstore three years ago. Instead, it has a wall of lockers and a desk staffed by Amazon. As part of a five-year contract the university signed with Amazon, students and faculty can buy textbooks online and have them shipped free to campus and nearby ZIP codes in a day, according to the university news service. (At least the contract was supposed to last five years. More about that shortly.)

Jessica Ruscello, via Unsplash

The decision to eliminate a physical bookstore wasn’t popular among many students and faculty members, the Greenfield Recorder reported. Some students complained about Amazon’s business practices. Some instructors didn’t like submitting their textbook selections to Amazon rather than to a campus bookstore. And Amazon is never popular among local merchants.

A few other colleges and universities have also eliminated their campus stores, including Purdue, Stony Brook, and Queens College. Others have kept their stores but allowed Amazon to install storefronts with lockers for one-day delivery. Amazon has pickup sites at 30 colleges and universities.

One of the advantages universities cite for these arrangements is lower costs to students. At least that’s the plan. The university doesn’t have to devote storage space to books, and Amazon’s enormous size allows it to provide the benefit of scale and convenience. Amazon also pays the universities a commission on sales or rent for campus space. Amazon guaranteed UMass commissions of $1.45 million over three years, according to the Greenfield Recorder.

Cost is no trivial matter as state support keeps declining and the individual costs of college keeps rising. UMass said its deal with Amazon was expected to save students $380 a year on textbook purchases, although the The Massachusetts Daily Collegian said students found that the savings were considerably less, especially because the free shipping did not apply to used books.

Those arrangements also don’t take into account the efforts that campus bookstores make to assist students. The KU Bookstore, for instance, has created an online price comparison tool to help students make decisions. It also works with KU Libraries, faculty and staff members to make open educational resources more readily available. And it sends all its profits back to KU through donations to campus programs and organizations.

Each campus bookstore has a different business model, but the money that Amazon promises to universities is increasingly difficult to pass up. At the University of Wisconsin-Madison, Laurent Heller, the vice chancellor for finance and administration cited decreased state funding as one reason the university found a deal with Amazon attractive, according to The Daily Cardinal.

“We need to find creative ways to gain revenue that goes along with our mission,” Heller was quoted as saying.

Those revenues don’t come without risk, though. At UMass, Amazon is ending its five-year contract after three years, according to the Recorder. That has left the university scrambling to find a book supplier for its bookstoreless campus starting next year.

I have mixed feelings about all this. I’m not anti-Amazon, and I certainly understand the trend toward electronic course materials and the delivery of books. Libraries have been moving in the same direction, repurposing stacks as collaborative space for students and moving many physical books to remote sites. (This isn’t always a smooth process either.) The growth of digital resources also reduces the need for physical space.

I’m certainly part of this trend. I do most of my reading electronically these days. With an e-book reader and a tablet, I read much more than I did before. The digital devices also make life easier. I can take and store notes without the need for physical filing cabinets, and retrieve them much more easily and accurately than if they were in paper form. The digital format also reduces space and makes large amounts of information much more portable.

Campuses definitely lose an important element when a bookstore goes away, though. As I walked through the UMass campus, the lack of a college bookstore felt disorienting. It was as if something vital had been removed. Without it, there was no physical location for getting a feel for the intellectual life of the campus, no single place for perusing course titles or picking up new ideas from interesting classes and books that instructors had chosen. Without a bookstore, the campus felt somehow more remote, more inaccessible.

I’ve written before about universities’ shift toward consumerism, about the way they have diminished the importance of learning by promoting themselves as carefree places with endless conveniences, cheering sports fans, and smiling students who seem to have little to do but stroll together across leafy campuses. The loss of campus bookstores fits into that trend, further hiding the intellectual life – the soul of higher education – behind the gloss of consumer appeal.

If we are to preserve that intellectual core, we need to work harder at making it more visible, especially for potential students and for the public. Otherwise, a campus becomes just a collection of buildings — buildings that at a growing number of universities lack a bookstore.

Briefly …

Fort Hays State University is taking a non-Amazon approach to remaking its bookstore. The university has entered into partnerships with Akademos, a company that provides an online portal for textbook sales; and indiCo, an arm of the National Association of College Stores that will handle general merchandise for the store. … A University of Maryland study supports the idea of using virtual reality for learning, with researchers finding that participants had better recall of information from a virtual environment than from a desktop computer, Campus Technology reports. … A survey by the New America Foundation finds that support for higher education may not be as politically divided as surveys last year suggested, Inside Higher Ed reports. Even so, respondents were much more supportive of colleges and universities near them than they were of higher education in general.


Doug Ward is the associate director of the Center for Teaching Excellence and an associate professor of journalism. You can follow him on Twitter @kuediting.

Everything you need to know for April Fools' Day


Everything you need to know for April Fools' Day

By Doug Ward

A short history lesson:

April Fools’ Day originated in 1920, when Joseph C. McCanles (who was only vaguely related to the infamous 19th-century outlaw gang) ordered the KU marching band (then known as the Beak Brigade) to line up for practice on McCook Field (near the site of the current Great Dismantling).

It was April 1, and McCanles was not aware that the lead piccolo player, Herbert “Growling Dog” McGillicuddy, had conspired with the not-yet-legendary Phog Allen to play a practical joke.

McCanles, standing atop a peach basket, raised his baton and shouted, “March!”

Band members remained in place.

“March!” McCanles ordered again.

The band stood and stared.

Then McGillicuddy began playing “Yankee Doodle” on his piccolo and Allen, disguised in a Beak Brigade uniform, raised a drum stick (the kind associated with a drum, not a turkey) and joined the rest of the band in shouting: “It’s April, fool!”

McCandles fell off his peach basket in laughter, and a tradition was born.

Either that, or April Fools’ Day was created in France, or maybe in ancient Rome, or possibly in India. We still have some checking to do.

Regardless, we at CTE want you to know that we take our April Fools seriously – so seriously in fact that we have published the latest issue of Pupil magazine just in time for April Fools' Day.

As always, Pupil is rock-chalk full of news that you simply must know. It is best read with “The Washington Post March” playing in the background. We don’t like to be overly prescriptive, though, especially with all the strange happenings brought on by an impending solar eclipse.


Doug Ward is an associate director of the Center for Teaching Excellence and an associate professor of journalism and mass communications.

April Fools' issue of Pupil magazine with a large picture of students in rounded glass tubes that fit in a pneumatic system

Study links rising tuition to decreased diversity


Study links rising tuition to decreased diversity

By Doug Ward

Here’s one more reason to worry about rising tuition rates: decreased diversity.

In an examination of 14 years of tuition increases at public colleges and universities, Drew Allen of Princeton University and Gregory Wolniak of New York University found that for every $1,000 that tuition goes up, racial and ethnic diversity among students goes down by 4.5 percent.

To put that into perspective, they point to a College Board report showing that between 2008 and 2018, average tuition and fees at public four-year colleges and universities increased $2,690, or 37 percent. In some cases, tuition rose by $1,000 in only a year or two, they write in The Conversation.

Allen and Wolniak’s study examined 600 four-year and 1,000 two-year public institutions between 1998 and 2012. The correlation between increases in tuition and declines in diversity was most pronounced at colleges and universities they described as the “least-selective.”

Relatedly, they found that a 1 percent increase in tuition at four-year private colleges or universities led to a 3 percent increase in diversity at nearby public institutions. In other words, tuition increases make a difference at both public and private universities.

“The end result is the nation’s colleges and universities become less reflective of the ethnic diversity of the United States as a whole,” Allen and Wolniak write.

The highest rejection rates, state by state

In the status-obsessed universe of higher education, colleges and universities often measure their standing by the percentage of students they reject.

It’s a circular process. Institutions deemed to be the best receive the highest numbers of applications. Those with the highest number of applications reject larger numbers of students, solidifying their desirability by maintaining low acceptance rates.

I won’t get into the validity of that game here, but I did think a recent a recent state-by-state list of colleges and universities with the lowest acceptance rates was interesting. You can guess many of them: Harvard (5.4 percent acceptance rate), Yale (6.3 percent), Princeton (6.5 percent), University of Chicago (7.9 percent).

You’ll probably have a harder time determining which universities in states other than Massachusetts, Connecticut, New Jersey, and Illinois have the lowest acceptance rates. At least I did. The website 24/7 Wall Street listed those universities in an article called “The Hardest Colleges to Get Into in Every State.” Not surprisingly, most are private universities, although a fair number are public.

In Kansas, Sterling College has the lowest acceptance rate (37.4 percent). That compares with more than 90 percent at KU, K-State and Wichita State. Other regents universities have slightly lower admission rates.

For comparison, here are the universities in surrounding states with the lowest admission rates:

  • Colorado: Air Force Academy (15.1 percent)
  • Iowa: Grinnell College (20.2 percent)
  • Missouri: Washington University (16.5 percent)
  • Nebraska: Creighton University (70.7 percent)
  • Oklahoma: University of Tulsa (37 percent)

These are the state universities that made the list:

  • University of Alaska (73.5 percent)
  • University of Arkansas (41.9 percent)
  • Clemson (50.5 percent)
  • Delaware State University (40.6 percent)
  • Georgia Tech (25.8 percent)
  • University of Idaho (75.9 percent)
  • University of Michigan-Ann Arbor (28.6 percent)
  • University of Washington-Seattle (45.3 percent)
  • University of Wisconsin-Madison (52.6 percent)
  • University of Wyoming (95.1 percent)

Interestingly, the increasing difficulty of getting into some public universities was recently identified as one of the top education trends to watch during the coming academic year. Scott Jaschik, editor of Inside Higher Ed, listed the growth of “public Ivies” among a trends list he offered to members of the Education Writers Association. In addition, he said, some universities have increased the number of students they put on waitlists, raising students’ hopes even as the likelihood of eventual admission declines.

Briefly …

A new study in the interdisciplinary journal PLOS One offers additional evidence for providing pedagogical training to graduate students. The study found that Ph.D. students who were trained in evidence-based teaching practices were just as good at research as those who focused on research alone. … MindShift offers four useful principles for approaching student-centered learning. The article is aimed at K-12 instructors, but it applies to college instructors, as well. … More colleges and universities now use Canvas than use Blackboard, e-Literate reports. In terms of market share, the two are tied at 28 percent, but Canvas has two more institutional users than Blackboard.

Doug Ward is the associate director of the Center for Teaching Excellence and an associate professor of journalism. You can follow him on Twitter @kuediting.

The importance of humanity in education’s future


The importance of humanity in education’s future

By Doug Ward

Robin Wright has a clear vision of the future of education.

Understanding that future requires a look 6,000 years into the past, though. It requires an assessment of the technological wonders that have promised revolution over the years. It requires an understanding of literacy rates, which have reached 90 percent worldwide. It requires a look into the chemistry of the brain, which reacts to emotion and stress but also to action and interaction. It requires a look outward at the students in our classes. And perhaps most important, it requires a look inward at who we are and who we aspire to be.

Robin Wright spoke about the human side of teaching and learning in her keynote address at Thursday’s Teaching Summit.

Wright made it clear that if we can do that, we, too, will have a clear vision of education’s future. (More about that shortly.)

Wright, a professor of biological sciences at the University of Minnesota, was the keynote speaker at KU’s annual Teaching Summit on Thursday. She shared with the summit’s 400 participants some of her research into active learning and student development, along with personal experiences in teaching undergraduate biology courses. Some of those experiences involved her own challenges as a teacher, including times when students simply weren’t understanding what she was teaching.

“This is where I made a big mistake,” Wright said. “If my students weren’t performing well, I just worked harder. That wasn’t a problem for them; they weren’t working harder. I wasn’t putting the burden on them.”

That is, she wasn’t following the key principles of learning. Here’s how she described those:

  • Every brain is different.
  • The person who does the work does the learning.
  • You can only make memories by connecting them to older memories.
  • People almost always learn better when they work together.
  • Making memories requires repetition, feedback, elaboration and sleep.

Until students do the hard work that learning requires, it doesn’t matter how many times instructors go over course material or how much effort they put into making classes active and engaging, Wright said. Mastery requires time and effort.

Don’t get the wrong idea from that. What instructors do has an enormous impact. Teaching and learning require concerted efforts by both students and instructors. That effort works best with human interaction, though. That was the message that Wright delivered again and again: that in a technology-fueled world, the human elements of education are more important than ever.

“The most important way we can be human is to teach,” Wright said.

Wright’s keynote address and workshops she led later in the morning tied into the summit’s theme, Teaching the Whole Student. That theme evolved from recent research suggesting that a holistic approach to education helps students succeed. We can’t just teach content. Nor can we throw students into that content and expect them to learn on their own. Rather, instructors and universities must engage students in education and help them gain a sense of belonging; support them in their educational endeavors and help them overcome barriers; and provide mentoring from staff members, faculty members and students’ peers.

Wright takes a question from Candan Tamerler, professor of mechanical engineering.

After the summit, Wright said that her message would not have been well received just a few years ago. Even now, critics berate universities for coddling students and encouraging hypersensitivity rather than pushing them to harden themselves for an unforgiving world. Wright steered clear of the political hyperbole, grounding her arguments in science, history, and the scholarship of teaching and learning. Even so, she acknowledged her role as provocateur as she made a case for what education is and what it could be.

Naysayers have tried to displace in-person education for centuries, she said. The first known correspondence course – one for shorthand – was offered in 1728. In 1906, a correspondence degree program in Pennsylvania attracted a million people but had a graduation rate of 2.6 percent, about the same as today’s massive open online courses. Thomas Edison promoted the phonograph as a great educational tool. Broadcasters did the same with radio and then television. MOOC creators promised a revolution – one that fizzled before it barely started.

Despite all these other opportunities and all the new technological tools that have emerged, we still have in-person education. Furthermore, Wright said, 90 percent of the world’s population can read and write. More and more of that population has access to the Internet and its vast universe of information, meaning that people can learn just about anything and anywhere on their own. And yet year after year, students and instructors still gather in classrooms to learn.

Why? she asked, quickly providing her own answer: Because the way we learn hasn’t changed since the days when people gathered around campfires, shared stories, and helped each other understand the world.

“Our brains are still the same as they were 6,000 years ago,” Wright said. “We still learn in the same way, the same basic way. That has not changed at all.”

Teaching to hundreds of brains

Wright explained the importance of brain chemistry and the role that stress, emotion, and sleep play in our ability to learn. She touched on social theory as a means of explaining learning, and the way that such factors as pedagogy, classroom climate, focus, motivation and metacognition influence individual performance. Our growing understanding of those factors continues to improve teaching.

“The challenge, though,” she said, “is how do you teach a whole class about mitosis when you have 400 different brains you have to interact with?”

That is, the same strategy doesn’t work for everyone.

“People look at things in different ways because their brains are different,” Wright said.

That’s where the human aspects of teaching must take over.

“We have to consider the whole person as a living, breathing, complicated, annoying, wonderful human being,” Wright said.

To emphasize that, Wright told of a high school teacher who once told her she was a good writer. Decades later, Wright still remembers that praise fondly, and she urged attendees to make the most of human interaction with their students.

“If you can do one thing to improve the effectiveness of your teaching and your learning, it’s to give people a chance to interact,” Wright said.

Adding a human touch to education also helps shape the future, she said.

“Being able to put your arm around a student and say, ‘You are really, really good at biology. I think you could have a career in it.’  That has enormous, enormous impact,” Wright said.

That doesn’t mean we should shy away from technology. Not at all. We should use it to its full potential to personalize teaching and learning, she said. In the end, though, the future of education lies in its humanity.

“There’s power in you as a living human being interacting with other human beings,” Wright said.

That power has kept education alive for millennia. And if Wright’s vision is correct, it will propel higher education into the future.


Doug Ward is the associate director of the Center for Teaching Excellence and an associate professor of journalism. You can follow him on Twitter @kuediting.

Subscribe to