Enrollment at Kansas regents universities declined again this year. I say again because enrollment has declined each year since 2011.
The decline – 5.7% since 2011 — is relatively small, but it illustrates the challenges of a state university system that has become increasingly dependent on student tuition dollars to finance operations. It also illustrates the challenges that regents universities will face in the next decade as the number of traditional college-age students flattens after a post-recession “baby bust.”
The National Center for Education Statistics projects that undergraduate enrollment nationwide will increase about 3% by 2028, but that national average blurs regional differences. Institutions in the Midwest and Northeast are especially vulnerable. Many smaller colleges have faced growing economic problems, with some merging and more than 20 closing.
KU isn’t in any immediate danger from those trends, but the regents system as a whole is. Given the current political climate, it seems likely that Kansas will face some of the same pressures that states like Wisconsin and Alaska have faced to close or merge campuses.
In Kansas, Wichita Area Technical College merged with Wichita State two years ago, a move that made sense given their proximity. It isn’t much of a stretch to imagine financial concerns forcing additional mergers – mergers that would be much more painful than the one in Wichita. Eleven of the state’s community colleges have had double-digit enrollment declines over the past five years, and three – Cowley, Allen and Highland – have seen enrollment fall by more than 20%. Even Johnson County Community College, the largest in the state, isn’t immune from this trend. Its enrollment has declined 7.8% over the past five years, although there was a slight uptick this year.
I’m not trying to predict impending doom. Rather, I see the numbers as a clear signal of the need to move quickly with innovative approaches that better meet the needs of a changing student population. Colleges and universities can no longer expect student applications to simply flow in with regularity. They must find niches that set them apart, form partnerships across disciplines and institutions, do more to reach out with online courses, and develop new approaches that make a college education more of an ongoing process – and one of individual renewal – than a degree-and-done-forever approach.
The numbers at KU
KU’s full-time equivalency enrollment fell slightly this year. As you can see from the chart above, though, there has been only slight movement over the past six years. That’s mostly good news, especially because retention rates have increased. This fall, 86.2% of last year’s freshman class returned, and retention of freshmen has increased substantially since hitting a low of 77.8% in 2008.
That’s a phenomenal accomplishment made possible by the work of everyone from instructors who have adopted more effective teaching practices to advisors who have helped students make better choices to administrators who have created new support programs and allocated money and resources to address a collective problem.
The university did a good job of highlighting other aspects of this fall’s enrollment report, so I won’t go into those. I would like to touch on some other trends I saw in the enrollment figures. These figures come from various reports and public dashboards on the site of Analytics and Institutional Research. Wherever possible, I have used full-time equivalency figures rather than headcount. The regents and the federal government have shifted to full-time equivalency because it cuts down on possible distortions from part-time enrollment and allows for a better comparison across universities. The university tends to prefer headcount.
Troublesome long-term trends
Combined enrollment at the Lawrence and Edwards campuses has been mostly stable over the past few years. The longer-term trends aren’t as positive. Enrollment has declined 10.5% since 2007 and 13% since a peak in 2008.
For KU as a whole, those declines have been partly offset by a growth of 11.2% at the medical center since 2014. Enrollment at the Edwards Campus has grown in each of the past four years but is 11% below where it was in 2011.
Not surprisingly, the largest decline in the student population has been in the College of Liberal Arts and Sciences. It still has the largest number of students by far of any college at KU, but undergraduate enrollment has fallen 21.6% since 2010, and graduate enrollment has fallen 18.2%. The largest percentage gains in undergraduate enrollment since Fall 2010 have been in business (up 122%) and engineering (up 46.3%).
Interestingly, the largest percentage increase overall was in non-degree-seeking students, whose numbers have risen 181% since 2010. There were 491 of those students this fall. That’s a small number in the overall enrollment picture, but it clearly shows an interest among a group that is rarely discussed when we talk about enrollment.
Shifting gender balance

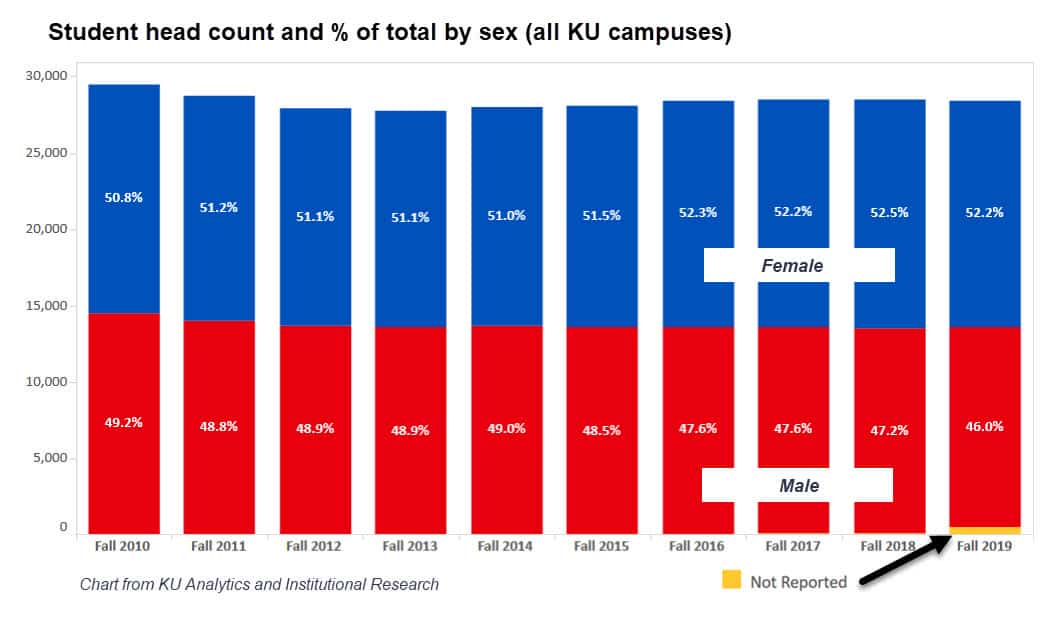
Men accounted for 46% of KU students this fall, the lowest percentage of the decade. The number of men enrolling at KU has declined from 49.2% in 2010, reflecting a national trend of fewer men going to college.
The number of students not reporting gender spiked this year to 524 from 75 in Fall 2018, 53 in Fall 2017 and 25 in Fall 2016. This reflects a national trend of students more willing to identify as gender fluid, transgender or non-binary.
Interestingly, the vast majority of those who did not report gender were graduate students. The breakdown of graduate students this fall is 50.6% women, 40.4% men and 9% not listing gender.
Other changes in student demographics
Several other changes in the characteristics of students are worth noting:
- Declining number of transfer students.Transfer students have never made up a large percentage of the student population at KU, but their numbers have fallen significantly during the past decade. In Fall 2010, the Lawrence campus reported 1,404 transfer students, compared with 1,024 this fall. That is a decline of 27%.
- Declining number of graduate students. The Lawrence campus has 5,570 graduate students this fall, a decline of 9.5% since 2016 and 13.5% since 2010. This is largely a result of a smaller number of students pursuing a master’s degree (down 19.8% since 2010), although the number of doctoral students has declined 9.1% from a peak in 2013.
- Declining number of international students. The number of international students fell for the fourth straight year and is now 14% below a peak of 2,363 in Fall 2015. This again follows a national trend.
- Rising number of Hispanic students. The number of Hispanic students attending KU has increased 65% since 2010, with growth in every year this decade. Hispanic students now make up 8% of the student body. This again reflects national trends.
- Rising number of part-time students. The number of part-time students on the Lawrence and Edwards campuses surpassed 4,000 for the first time this fall. Part-time students now account for 16.3% of the total student population, the highest percentage this decade and up from 13.7% in 2012.
Changes at Edwards Campus
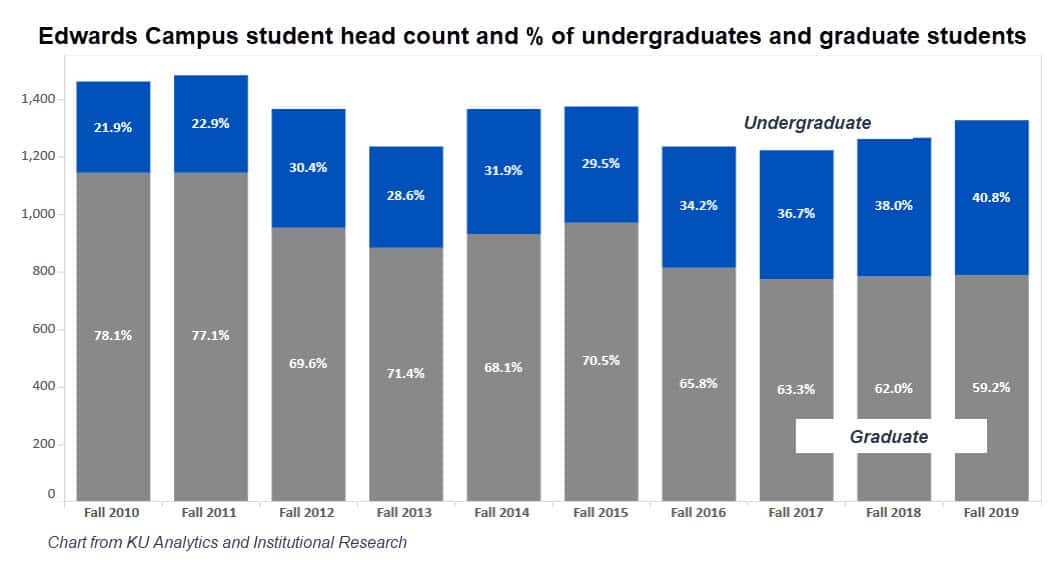
 KU’s Edwards Campus has traditionally been reliant on professional master’s programs for its enrollment. That has begun to shift toward more of a balance of graduate and undergraduate programs.
Undergraduates now account for nearly 41% of students at the Edwards campus, nearly double the percentage of a decade ago. That is an enormous shift in mission and mentality. The campus is still heavily reliant on working professionals who attend evening classes, but it has increased its online offerings, partnered with Kansas City-area schools and businesses, and drawn undergraduates to programs like information technology, molecular biosciences and exercise science.