Interpreting results from the student survey of teaching (2021-2025 version)
Understanding the structure of the student survey of teaching can help instructors interpret and use the data from of the survey. We recommend integrating the results into the Benchmark for Teaching Effectiveness framework, which CTE developed to help instructors and institutions gather, use and interpret evidence of teaching effectiveness.
The 2021-2025 version of the survey has four sections:
Students complete Parts 1 and 2 only once for a course. If a course has multiple instructors, students complete Parts 3 and 4 for each instructor.
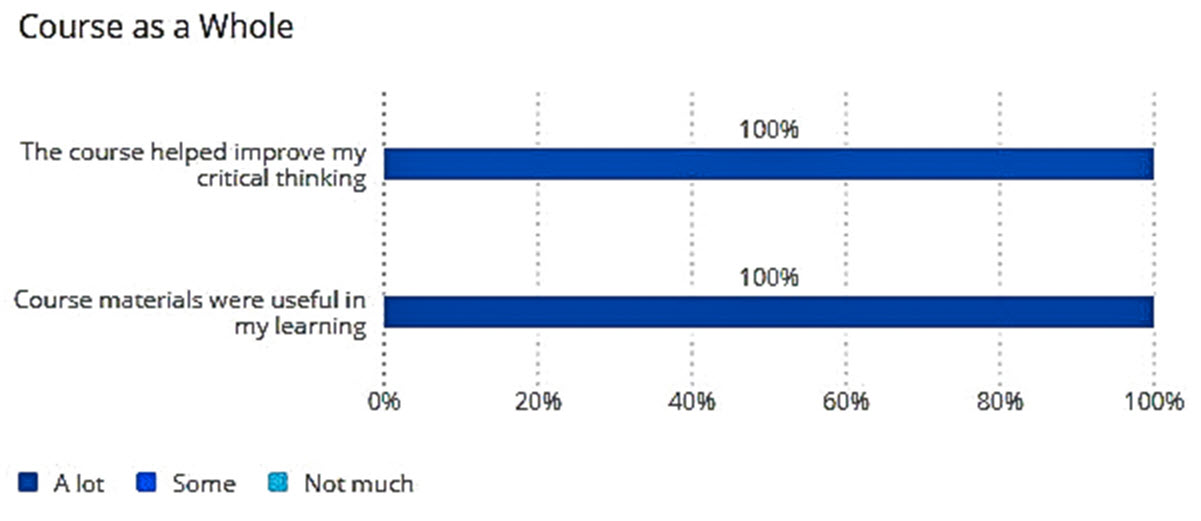
Part 1: Course design and content. Focuses on how much the course helped with critical thinking (a lot, some, not much) and how useful course materials were to the student. Open-ended questions ask what aspects of a course were most helpful to learning and what areas need improvement.
Part 2: Time spent on course. Estimate of hours spent on coursework, comparison to time spent in other courses. This section also allows students to provide additional comments.
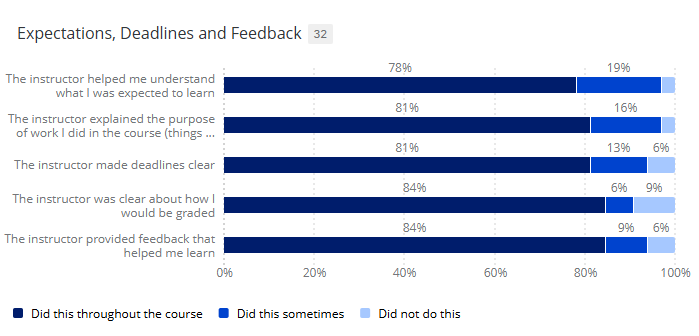
Part 3: Expectations, deadline, feedback. Includes questions on clarity of expectations, grading criteria, and deadlines; perceptions of feedback an instructor provided. Practices such as setting clear expectations, providing timely feedback, and helping students understand the purpose of coursework have been shown to improve engagement, motivation, and learning
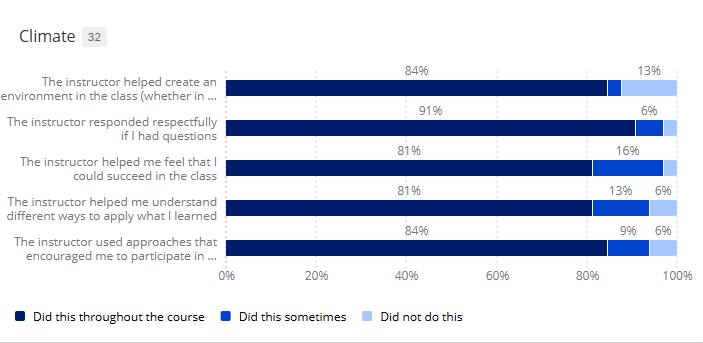
Part 4: Class climate. Perceptions about learning environment, respect of instructor, and instructor’s ability to encourage and promote student success.
The questions in each section are shown below.
Questions:
- The course helped improve my critical thinking (a lot, some, not much)
- Course materials were useful in my learning (a lot, some, not much)
- What aspects of the class were most helpful to your learning? (open-ended)
- What aspects of the class need improvement? (open-ended)
This section captures student perceptions of course design and content. These items are separated from instructor-specific items because some courses have multiple instructors or are taught by someone who did not design the course, and are most relevant for instructional staff who had a role in setting course goals, selecting materials, or organizing the course.
Results can provide evidence of student views of
- How well the course developed critical thinking skills
- How useful course materials were to student learning
- Specific strengths and areas for improvement, particularly when open-ended responses align with specific ratings and other evidence provided by the instructor or peers
This section asks students to estimate of hours spent on coursework and compare to time spent in other courses.
Questions
- Outside of scheduled class meetings and exams, about how much time did you spend on this course per week, on average?
- Compared with other classes you have taken at this level, how much time per week did you spend on this course?
The questions about time are intended to help instructors gauge students’ perceptions of time spent on homework, reading, studying, and other outside-of-class assignments. This can be especially helpful when viewed over a series of semesters or after a class has undergone substantial changes.
Questions (response options- did this throughout the course, did this sometimes, did not do this):
- The instructor helped me understand what I was expected to learn
- Explained the purpose of work I did in the course (things like discussions, assignments, exams, class activities)
- Made deadlines clear
- Was clear about how I would be graded
- Provided feedback that helped me learn
This section asks students how clearly the instructor communicated learning expectations, the purpose of coursework, deadlines, and grading criteria, and how helpful their feedback was. Research consistently links practices such as setting clear expectations, providing timely feedback, and helping students understand the purpose of coursework to stronger student engagement, motivation, and learning.
Results can provide evidence of:
- Transparency of expectations
- Clarity of course structure and purpose and relevance of course activities
- Effectiveness of feedback
Questions (response options- did this throughout the course, did this sometimes, did not do this):
- The instructor helped create an environment in the class (whether in person or online) that motivated me to learn
- Responded respectfully if I had questions
- Helped me feel that I could succeed in the class
- Helped me understand different ways to apply what I learned
- Used approaches that encouraged me to participate in class activities (in person or online)
The section ends with an open-ended response question:
- Is there anything else you’d like the instructor to know about the learning environment of the class?
This section elicits student perceptions about learning environment, respect of instructor, and instructor’s ability to encourage and promote student success. A class environment, whether in person or online, in which all students feel respected and encouraged to succeed is a crucial component of motivation and learning. Results can provide evidence of
- Inclusivity of environment
- Level of engagement in a class
- Student-instructor interaction
- Responsiveness of instructor
- Practices that motivated students
How do I use the data?
The revised survey contains a considerable amount of information that instructors or evaluators can use to demonstrate teaching effectiveness. The interactive dashboard shows the percentage of students who selected each response category, making it easy to see how frequently students reported different experiences in your classes. The dashboard's flexible data views allow you to filter results by course and semester. The trend analysis feature allows you to compare results across multiple semesters, helping identify patterns in student feedback and track changes over time.
Below are examples of how instructors could integrate student responses into a narrative about their own teaching. Evaluators could use the data in a parallel way. The Benchmarks project page has more guidance about how to reflect on and create a narrative about teaching, and how to review evidence of someone else’s teaching.
The sections with the survey questions include examples of how results from questions can provide evidence for evaluations.
Examples of instructor reflections on the survey: Expectations, Deadlines and Feedback
Transparency and expectations
Seventy-eight percent of students said I consistently helped them understand what they were expected to learn, an increase of about 10 points over last semester. That suggests that changes I made before this semester started are paying off. I revised syllabus language and provided additional explanations in class for each assignment. That seemed to help students better understand course goals and expectations.
Clarity on grading
Eighty-four percent of students said I consistently made grading expectations clear, an increase of 20 points over last semester. I’m pleased with that. I have been experimenting with a new approach that has helped reduce the time I spend grading student assignments, but some students have been perplexed by that approach. I have added explanatory material and spent time in class explaining the grading procedures, something I will continue to do.
Feedback provided by instructor
Eighty-four percent of students said the feedback I provided on their work last semester consistently helped them learn. I am pleased with that. I pride myself on the written and oral feedback I give to students. I meet with students individually at least once a semester, and I rotate among groups each week, allowing me to give on-the-spot feedback in class. For the past four semesters, I have also been experimenting with audio and video feedback on student work. This combination of approaches has increased the percentage of students who find my feedback helpful over the six semesters I have taught the class, as the graph below shows. The quality of student writing has also improved since I began using this approach.
Class climate
The student feedback about the course climate is good, but I need to dig deeper into some of the areas. While most students felt I responded to their questions respectfully, their responses to other items indicate I was less successful in engaging and motivating some. I do give students difficult material to grapple with from the beginning of the course, using that to motivate them to work hard and to enable me to gauge their incoming skills levels. However, some students did poorly on this early material and disengaged from the class. Next semester, I will try providing more scaffolding in the early part of the course to help them acquire some of the skills needed to succeed on that difficult material. I also plan to gather midterm feedback from students next semester and talk with them more about how I approach teaching so that I can identify problems early enough to address them.
Examples of instructor reflections: Course Design and Content
Course materials and critical thinking
I have either created or curated all of the materials I use in this class, and I try to keep them up to date and relevant. Students have consistently complimented the readings I have selected, and I supplement those with readings that students suggest. I have also created a reading guide, a guide for writing effective arguments, and a guide for finding data for student projects. Students’ impressions of their learning clearly align with my own. In their final assignment, almost all students showed proficiency using evidence to critically evaluate theories in the discipline. I will continue to monitor their performance and their feedback, updating course materials whenever necessary.
Addressing changes in student feedback over time
The trend analysis feature of the dashboard was added in in Fall 2025. It allows instructors or evaluators to display student survey results for the same item across multiple semesters. This can be done either within a course or aggregated across courses, helping identify patterns in student feedback and track improvements over time. Here is an example from the Climate section:

Example Reflection: Changes Over Time
Over the past few years, I've worked to provide more opportunities for students to apply their learning to authentic problems, primarily through in-class case study discussions. The results are encouraging: Students are performing better on application-oriented test questions, and my student survey data show that their perceptions of being able to apply course material have steadily improved across the last five course offerings. This alignment between performance and perception suggests that these pedagogical changes are enhancing student learning in meaningful ways. I plan to continue refining this approach in future semesters.
The process of changing the survey started in 2018, when Faculty Senate created an ad hoc committee charged with making recommendations for improving response rates to online student surveys of teaching. A recommendation from that committee led to the formation of a task force on revising KU’s standard survey form. The task force, which was created by the vice provost for faculty development, began meeting in Spring 2020.
The current survey was used for the first time in Spring 2021. It is intended to allow the student voice to come through while reducing bias as much as possible. It eliminated the 1-5 rating scale and department comparisons, replacing them with three-point scales that focus on the frequency of use of effective and inclusive teaching practices.
Before 2020, the standard student survey form was last changed in 2007-08. Teaching has changed substantially since then, and the revised survey is intended to provide feedback on many different forms of teaching that KU instructors use. Student surveys of teaching have also come under increasing scrutiny nationwide for biases against women and faculty of color, with numerical scores seen as particularly unfair. Survey results also fail to reflect the innovative approaches that instructors have taken to improve student learning. For example, faculty members spent countless hours adapting classes for hybrid and online formats during the pandemic, and they deserve recognition for that work.
One of the best ways to address those problems is to use an evaluation system that provides multiple sources of evidence, an approach that KU’s policies already reflect. To emphasize the importance of multiple sources, we have tied questions in the revised student survey to specific dimensions of CTE's Benchmarks for Teaching Effectiveness project, which is part of a multi-university initiative funded by the National Science Foundation. The latest draft of the survey was informed by a wide body of research and focuses on aspects of a course that students are best able to judge.